Every year, penetration testers document a detailed picture of how modern defenses actually hold up under adversarial conditions and evolving threats. All findings in our state of penetration testing report 2025 come from manual penetration testing and red teaming engagements. No findings from automated scanning, theoretical attack scenarios or false positives
The 2025 Annual Penetration Testing Review by Blaze Information Security covers 660 penetration tests conducted over the past year across 145 organizations, yielding 3,294 confirmed vulnerabilities. The following blog post summarizes the key findings and what they mean for the security professionals, compliance teams, developers, and IT specialists building and defending systems today.
Who We Pentested: Client Distribution by Size and Testing Volume
One of the more instructive patterns in the 2025 dataset is the relationship between organization size, industry, and how frequently those organizations commission security testing. The largest clients in the dataset — concentrated in the E-Commerce & Retail sector — are also the ones driving the highest volume of assessments. Retail accounts for 242 penetration testing projects in total, the highest of any industry, ahead of Finance & Fintech at 182. The numbers reflect the complexity of large retail IT environments, which typically encompass multiple brands, regional platforms, mobile applications, APIs, and third-party integrations, each requiring separate or recurring security validation. These organizations test more because their attack surface demands it.
The industries that test most frequently — Retail, Finance — also tend to show lower proportions of critical and high severity findings. That is not a coincidence. Sustained testing cadence builds institutional knowledge of the attack surface, drives remediation discipline, and surfaces design-level issues before they compound. The correlation between testing frequency and severity distribution is one of the clearest signals in the dataset.
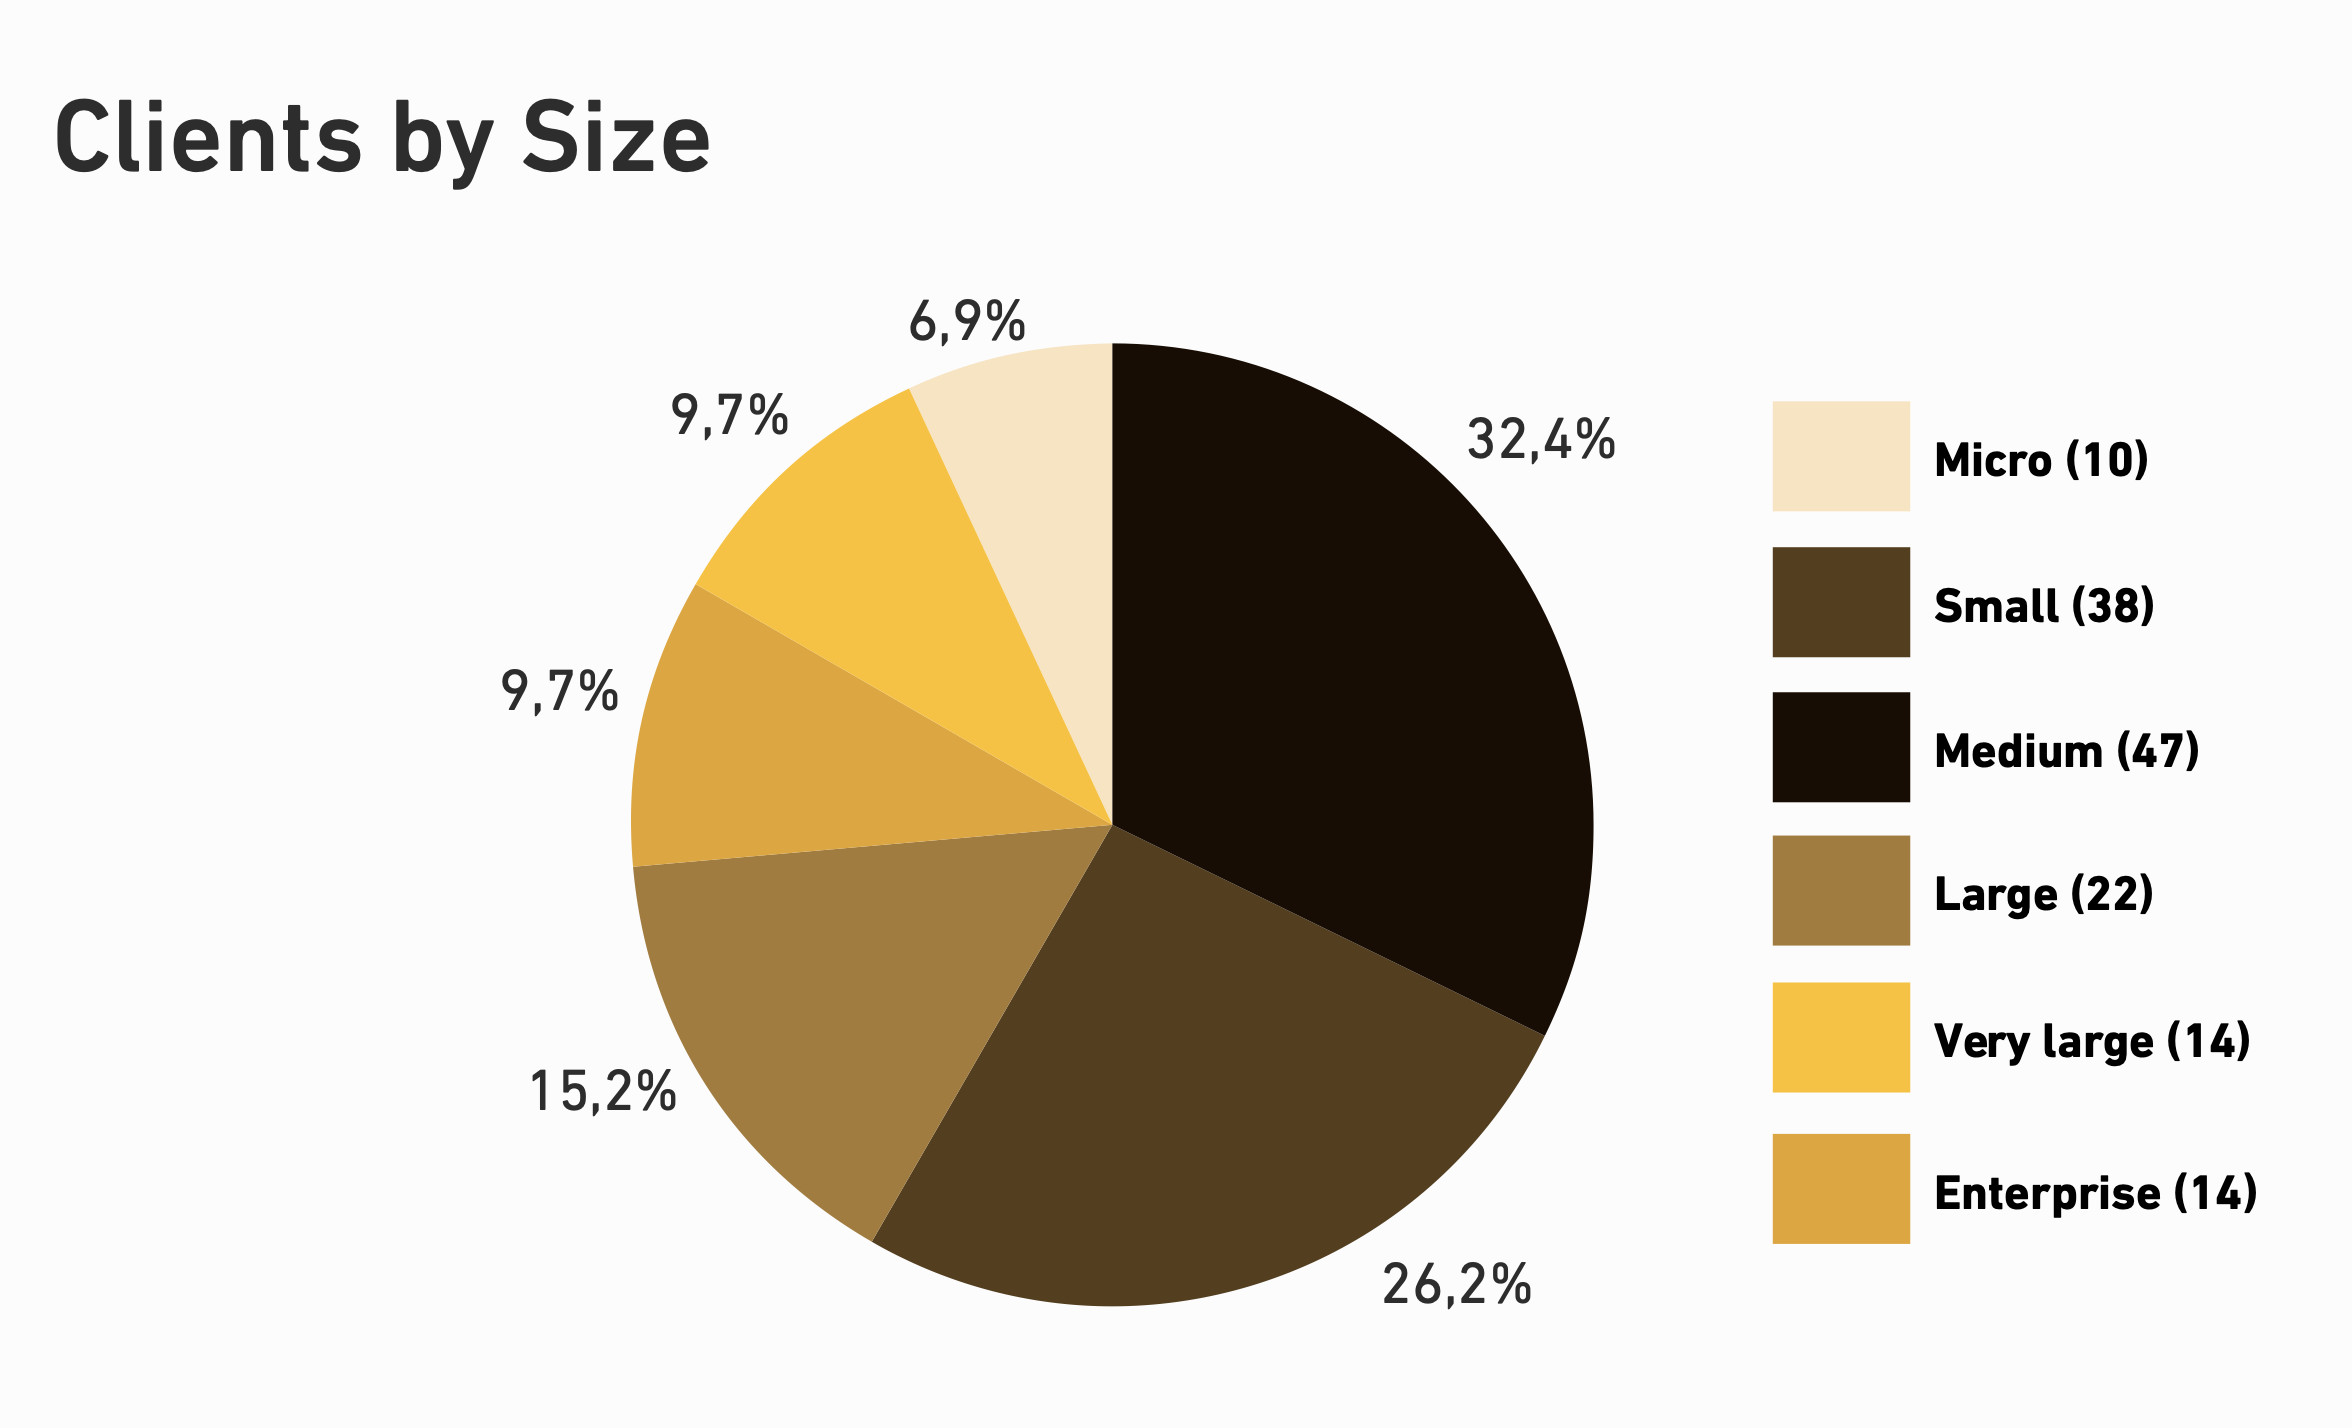
Turning to the client breakdown by organizational size: medium-sized organizations represent the largest single cohort at 32.4% of clients, followed by small businesses at 26.2% and large at 15.2%. Very large and enterprise-scale organizations each account for 9.7% of the client base, with micro organizations making up the remaining 6.9%.
Such client distribution matters for interpreting the findings. The dataset is not skewed toward large enterprise environments with mature security programs and dedicated security teams — the majority of clients fall into the small-to-medium range, where security resources are typically more constrained, tooling is less mature, and security decisions are more likely to be driven by the need to meet compliance regulations or incident response than by proactive risk management. That makes the prevalence of severe, exploitable vulnerabilities across the dataset more significant, not less: these are not findings extracted from unusually complex enterprise environments. They reflect the security posture of the kinds of organizations that make up the majority of the modern digital economy.
At the same time, the presence of very large and enterprise clients in the dataset and the fact that they test the most, provide meaningful benchmarking data at the upper end of the maturity curve. As discussed later in the industry benchmarks section, higher testing frequency and larger security investments do correlate with lower proportions of high-severity findings — but they do not eliminate the authorization and design-level weaknesses that dominate the dataset across all segments.
Authorization Remains the Most Persistent Security Weakness
One of the clearest patterns emerging from the 2025 security assessments is the persistence of authorization failures.
Fully unauthenticated, “open door” vulnerabilities are declining. Many organizations have implemented baseline controls around encryption, authentication and perimeter exposure. But within those perimeters, the story changes significantly. A vast majority, over 85%, of all vulnerabilities in the dataset are exploitable over a network. More than half require no prior authentication at all. And when authentication is present, the most common failure mode is not bypassing it — it is legitimate, authenticated users being able to access data or perform actions they were never supposed to reach.
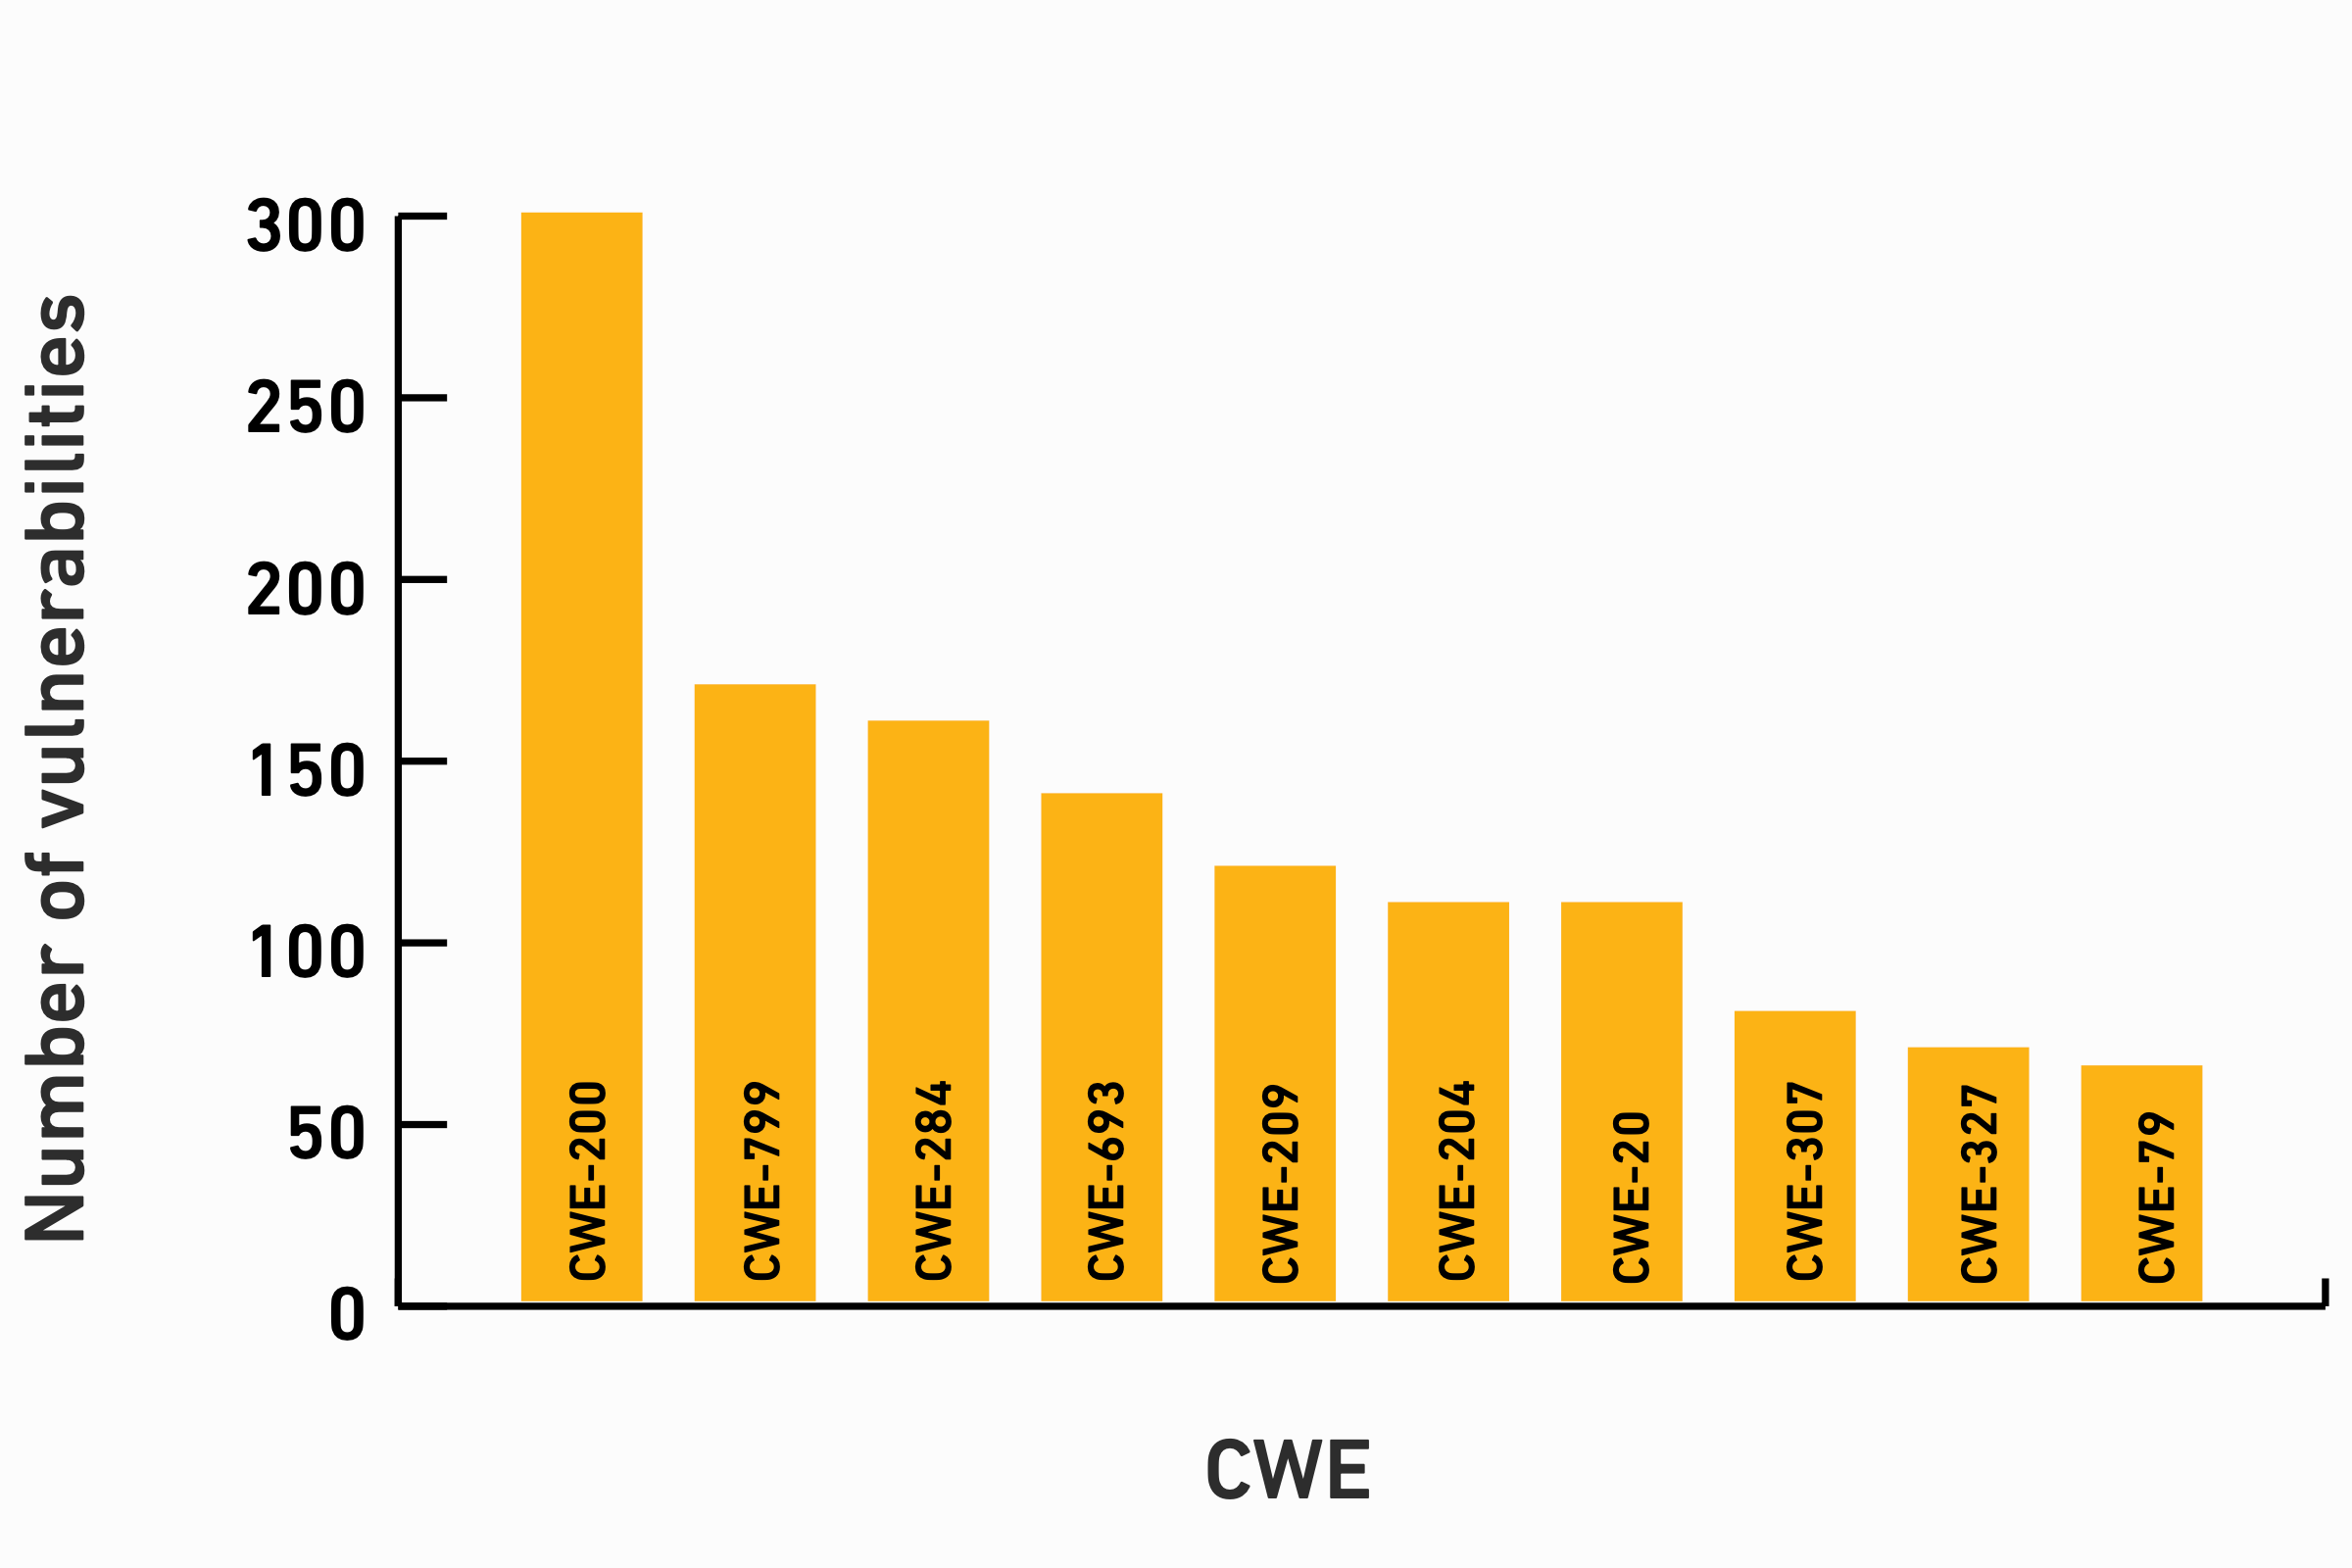
The operational reality of the authorization problem is that identity exists, but authorization is incomplete, inconsistent, or incorrectly enforced. CWE-284 (Improper Access Control) appeared 164 times across engagements, with 64 of those instances classified as Critical or High severity — making it the single most influential weakness in terms of real-world exploit potential. Authorization failures are not edge-case bugs. They are recurring, systemic failures in how trust boundaries and permission models are designed and enforced across real application workflows.
Most Common Vulnerabilities
Severity Distribution: A Deceptive Majority
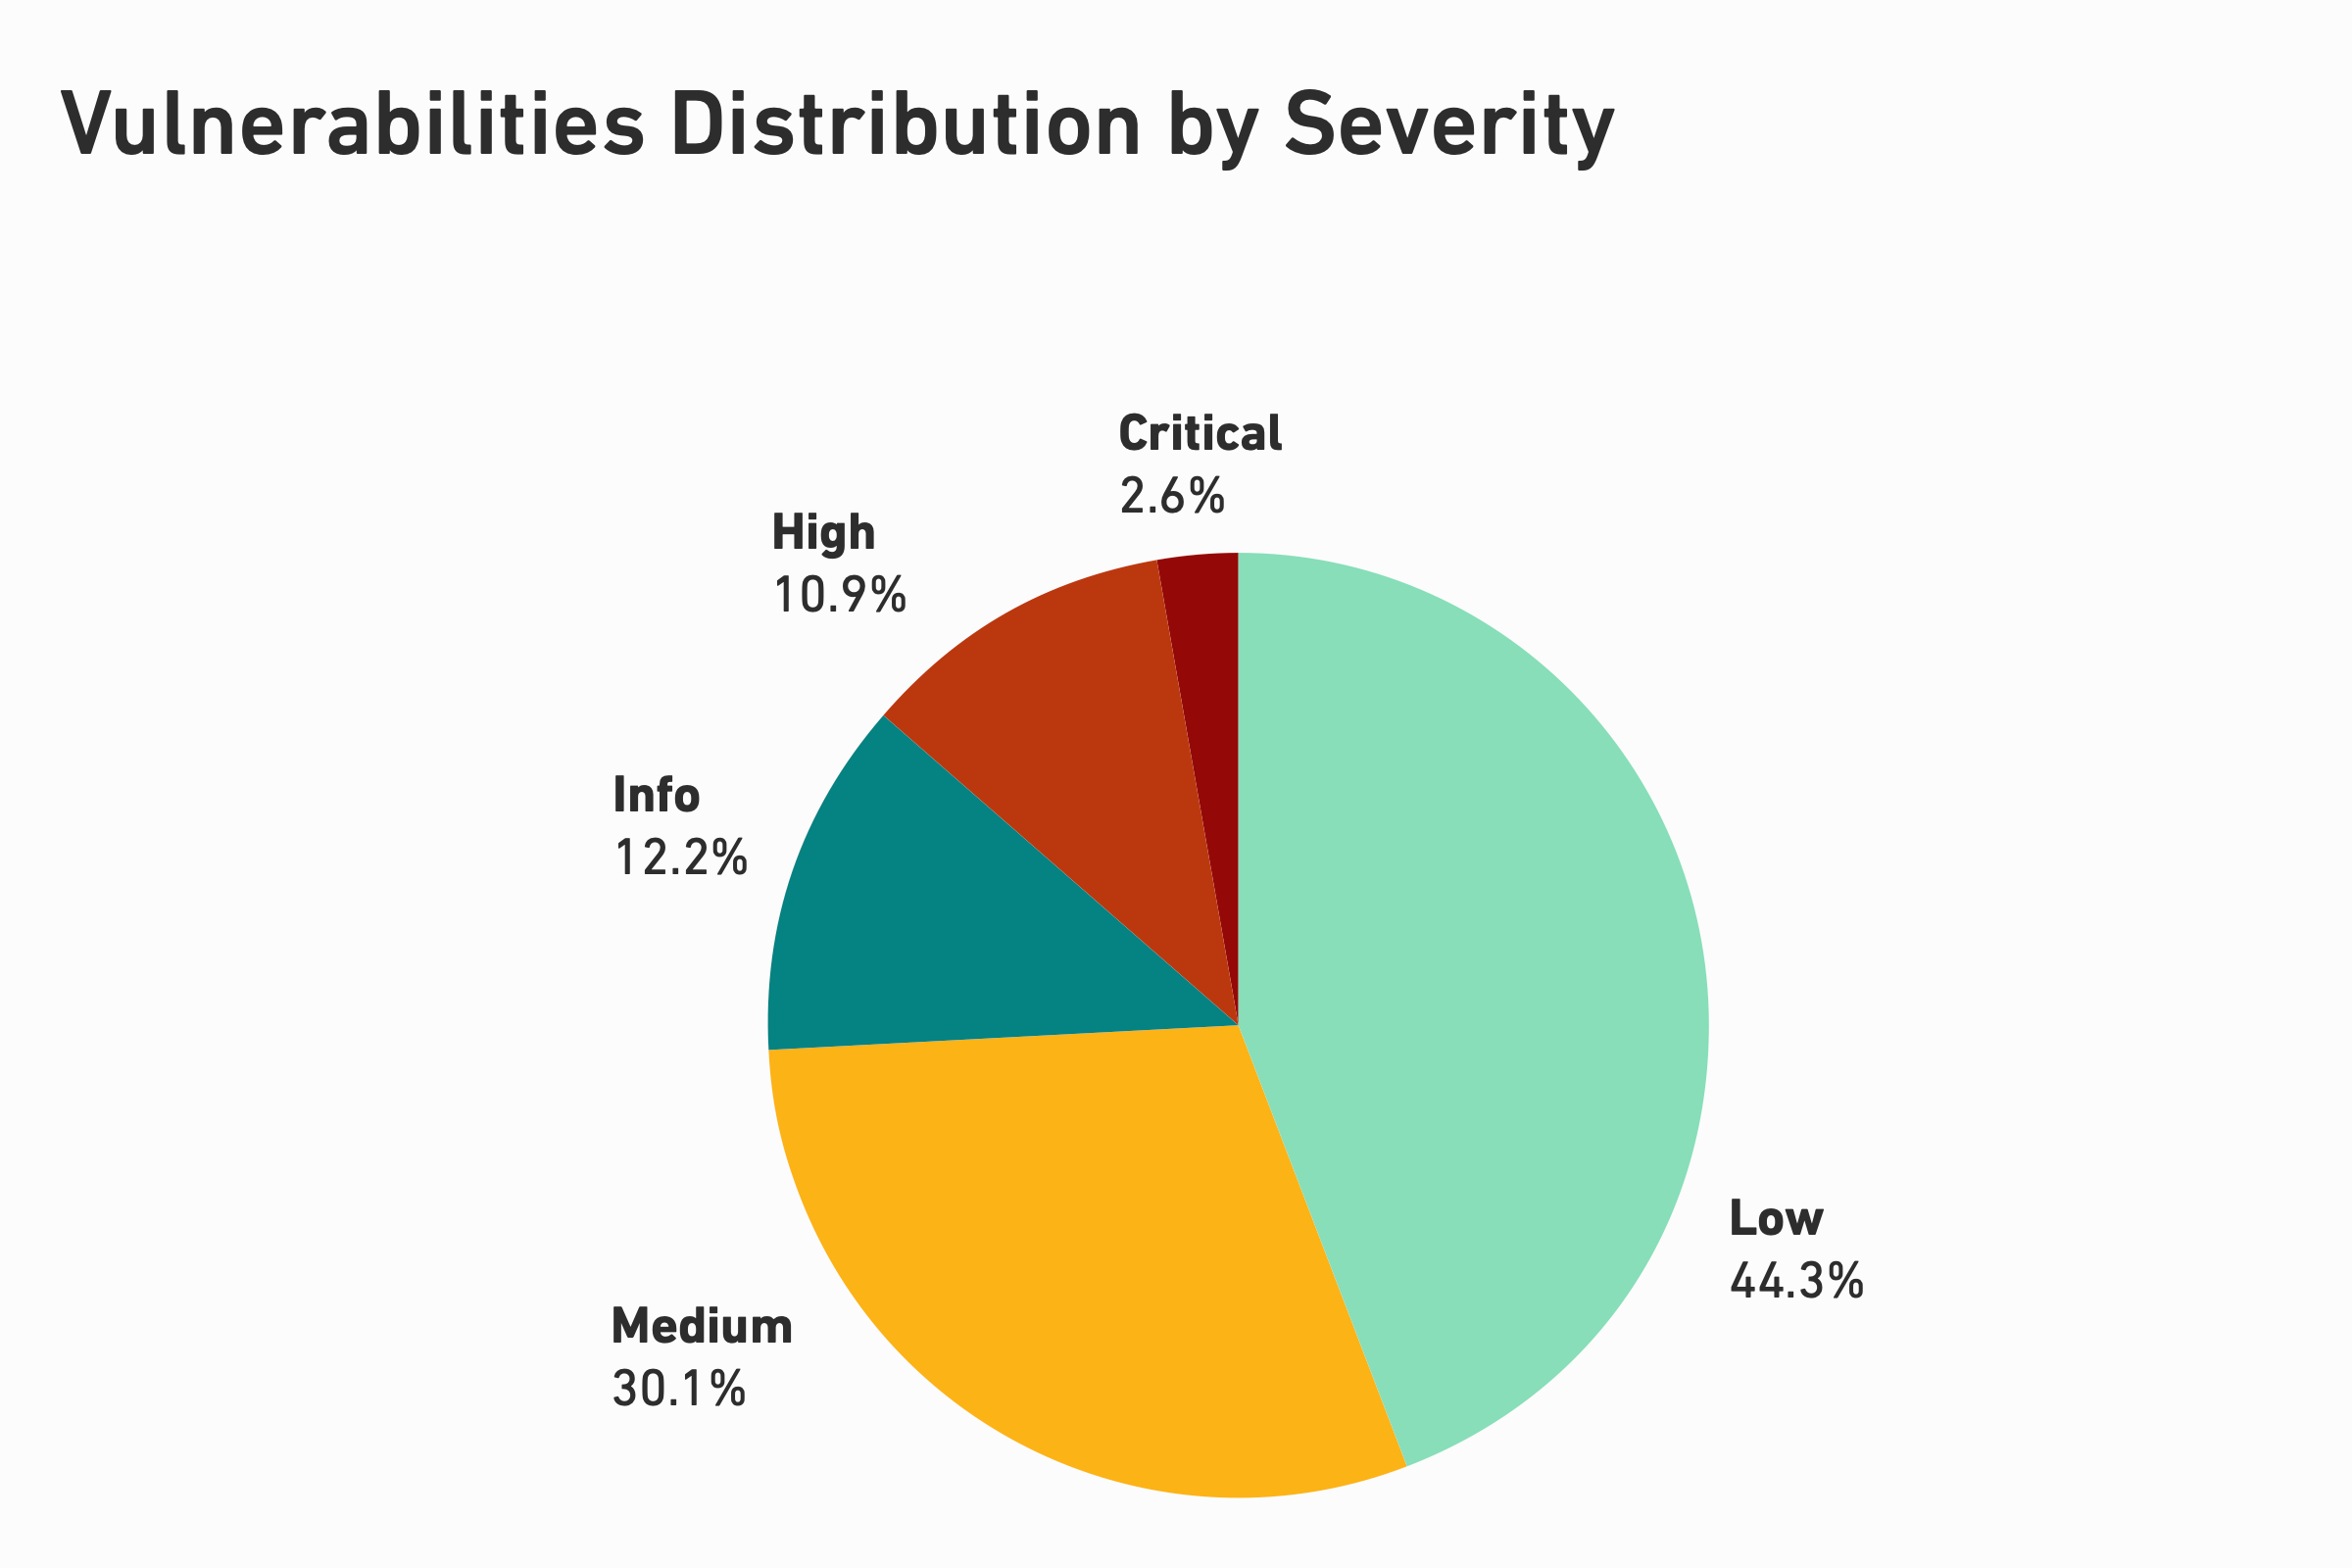
Looking at the raw severity breakdown, over half of the findings — 56.5% — fall into the Low and Medium categories. That number can be reassuring in the wrong hands. It should not be.
The 84 Critical and 358 High findings that account for approximately 13.5% of all vulnerabilities are disproportionately associated with access control failures, broken security controls, and design-level weaknesses commonly observed in real-world cyber incidents. These are the vulnerabilities that enable unauthorized access, privilege escalation, and large-scale data exposure. They are not concentrated in the most technically exotic attack classes; they come from recurring, well-understood failure modes that continue to exist across most organizations, regardless of company size and sector.
More telling: 364 vulnerabilities — 10.9% of the entire dataset — scored “High” in at least two of the three CVSS impact dimensions simultaneously (confidentiality, integrity, and availability). These multi-dimensional findings represent the most operationally dangerous scenarios: attackers who can exfiltrate data, modify systems, and potentially disrupt operations in a single exploitation chain.
The top five vulnerabilities with the highest multi-dimensional impact scores tell a consistent story: CWE-284 (Improper Access Control), CWE-79 (Cross-site Scripting), CWE-250 (Execution with Unnecessary Privileges), CWE-269 (Improper Privilege Management), and CWE-295 (Improper Certificate Validation).
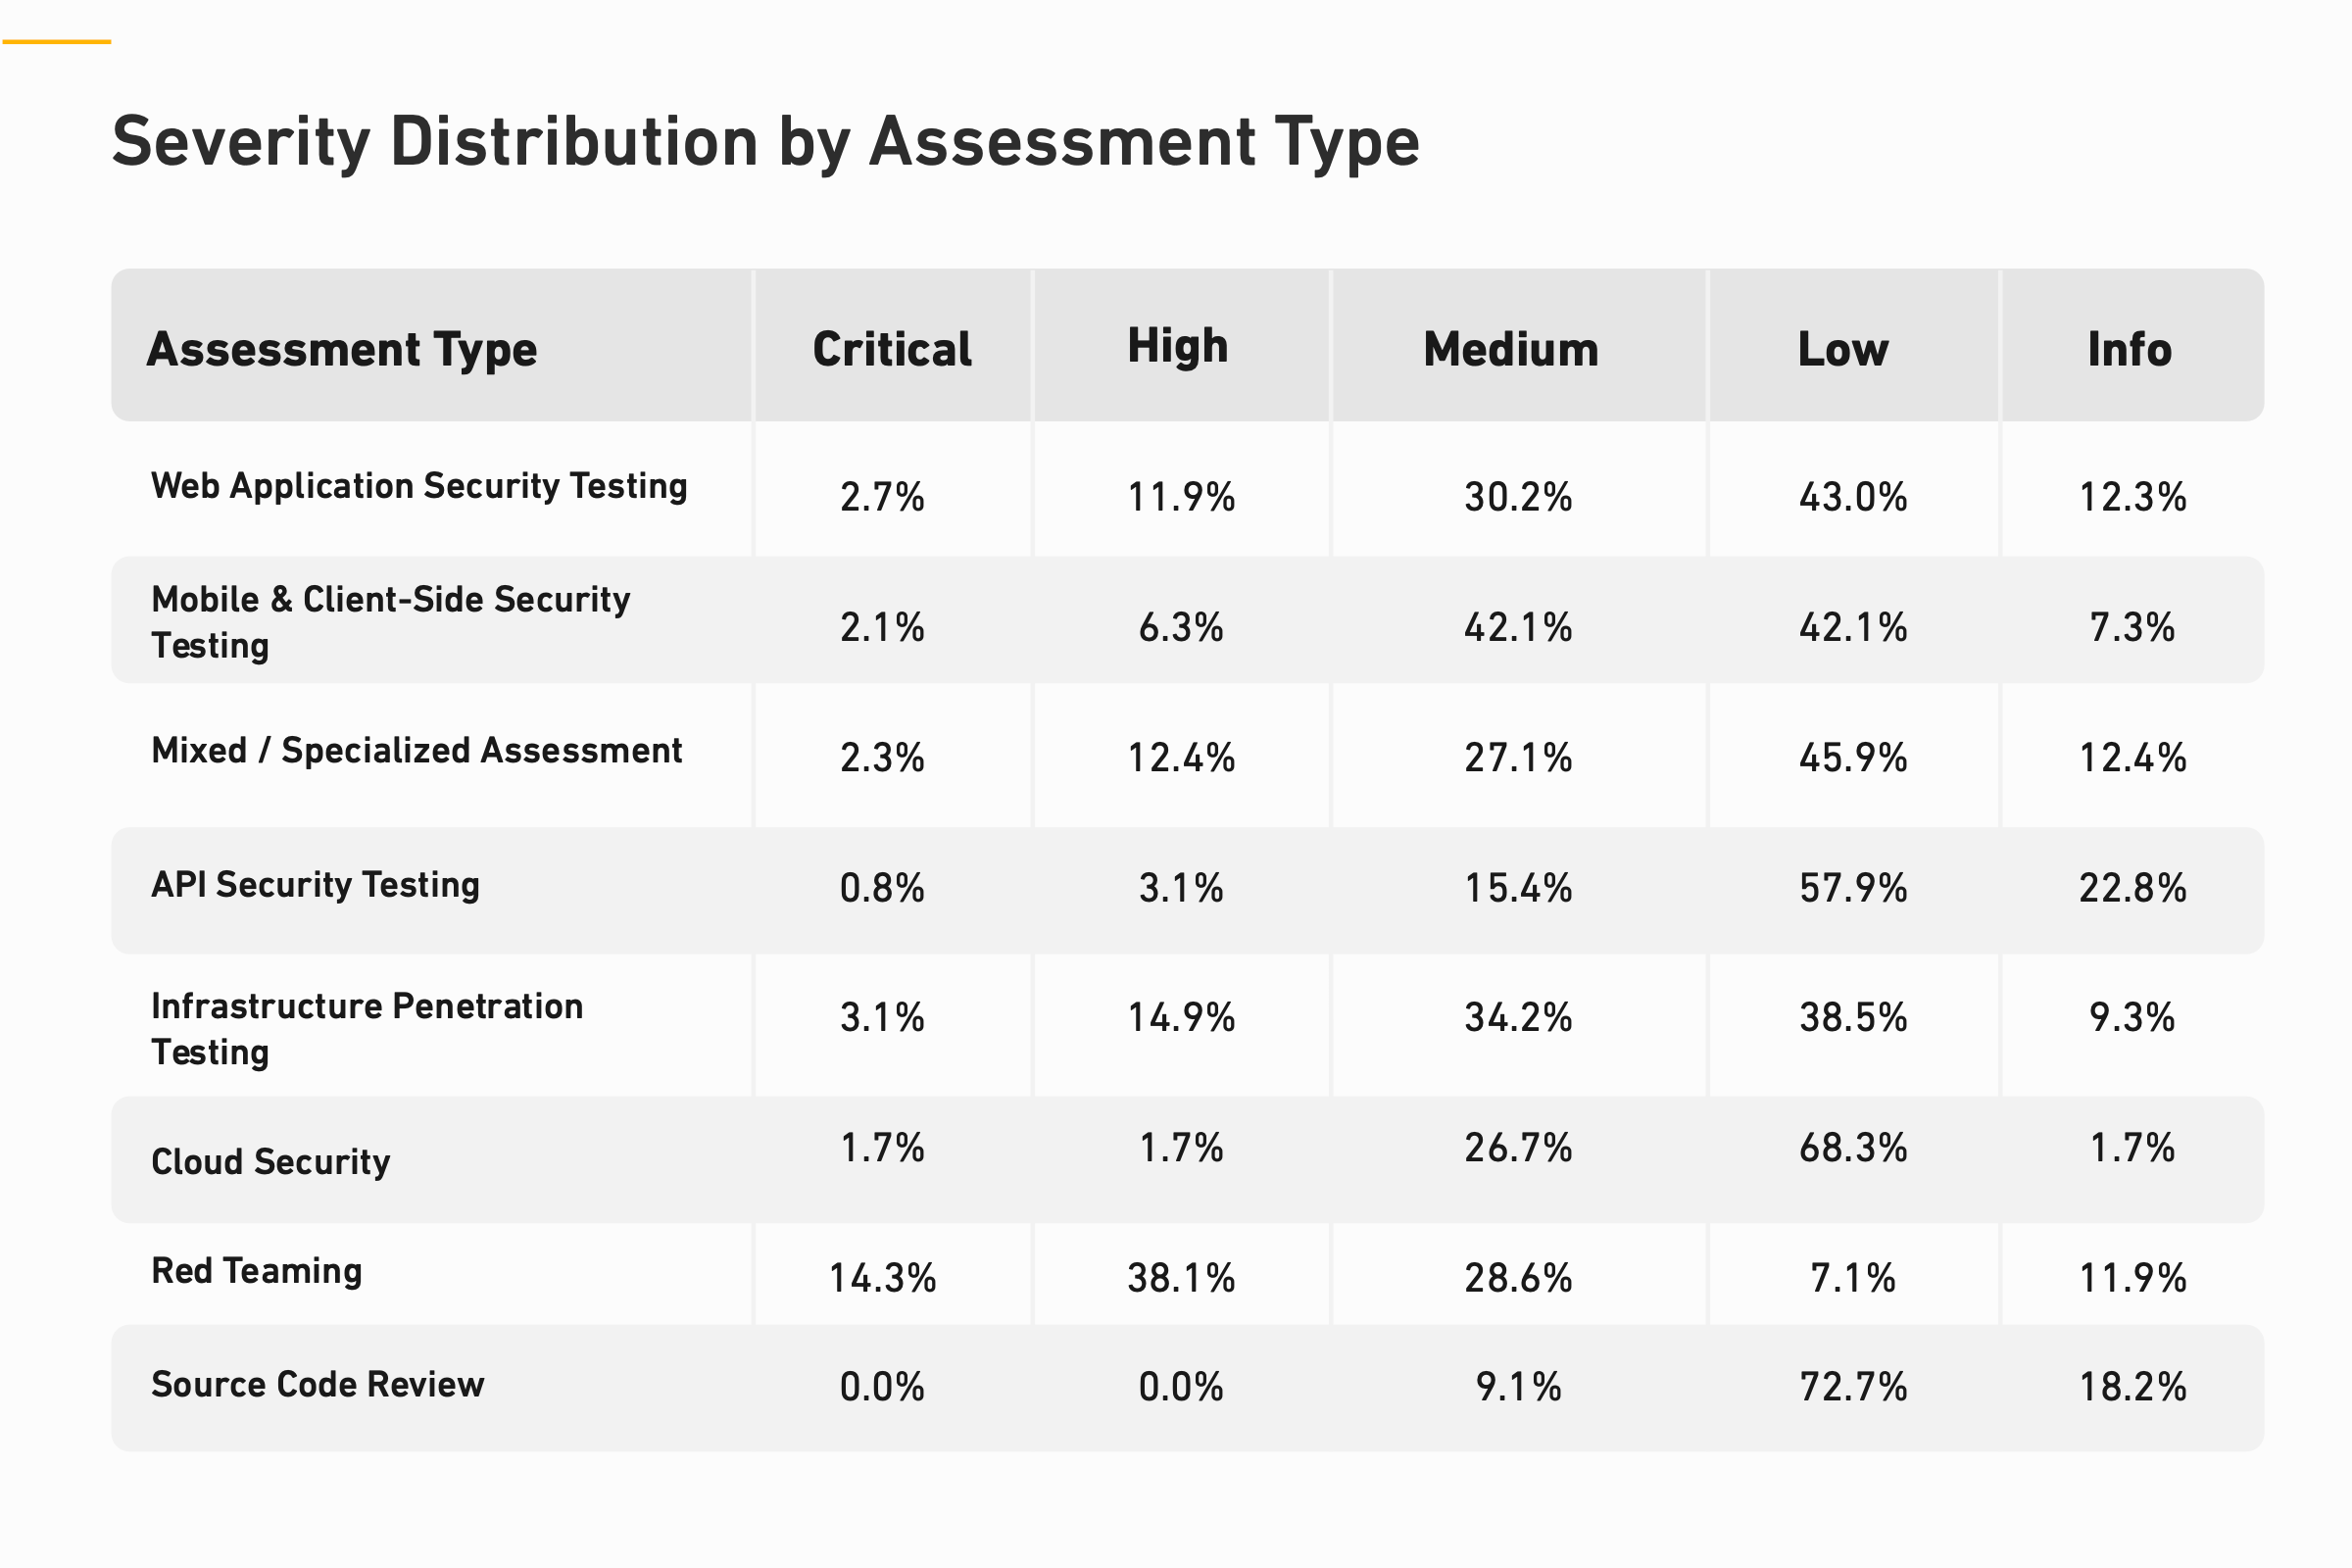
What Gets Found Depends on Where You Look
Perhaps unsurprisingly, the most tested surface — web applications at 60.8% of all engagements — also contributed nearly 60% of all identified vulnerabilities. But raw volume misleads. When findings are normalized by the number of assessments performed, cloud security assessments yield the highest average vulnerability density: 14.40 vulnerabilities per project on average. Mobile applications and red team engagements follow, while the overall project average sits at 4.99 vulnerabilities per assessment.
Such findings matter operationally. Organizations that limit penetration testing to web app assessments are getting an incomplete picture of their exposure. Modern IT environments increasingly include cloud platforms, APIs, mobile applications, and systems powered by artificial intelligence and large language models (LLMs) — all of which introduce new attack surfaces that require dedicated security testing.
Cloud infrastructure in particular produces fewer findings in absolute terms — but those findings are dense and tend to cluster around misconfigured IAM, overly permissive roles, and protection mechanism failures that can have an outsized blast radius.
The breakdown by assessment type reinforces specific risk profiles worth understanding:
Web applications are dominated by information exposure, access control failures, and rate-limiting gaps. In practice: sensitive data leaking through endpoints or error messages, users reaching records they should not, and inadequate anti-automation controls. These are the “classic” web risks — and they have not gone away.
APIs concentrate around authorization and data exposure: endpoints returning more data than necessary, weak object-level authorization, and authentication gaps. The recurring failure pattern is APIs that assume trusted callers, rely on client-supplied identifiers, or apply access control inconsistently across endpoints.
Mobile applications reveal confidentiality and cryptographic hygiene issues — sensitive data exposure, insecure local storage, improper certificate validation, and cleartext transmission. The risk surface extends across the full data lifecycle: storage, logging, networking, and authentication flows.
Infrastructure findings point to credential weaknesses — weak passwords, insufficient hardening of privileged accounts, and security gaps in segmentation. These map directly to lateral movement and privilege escalation paths once any foothold is established.
Cloud environments (primarily AWS in this dataset) show permissioning and data exposure failures: incorrect permission assignments, overly broad roles, and missing enforcement of defense-in-depth principles. Because cloud is permission-driven by design, even minor configuration errors compound.
Red team engagements are dominated by credential and access control themes — which is precisely the point. Threat actors do not generally win through exotic exploits but identity weaknesses, weak passwords, and inadequate privilege controls.
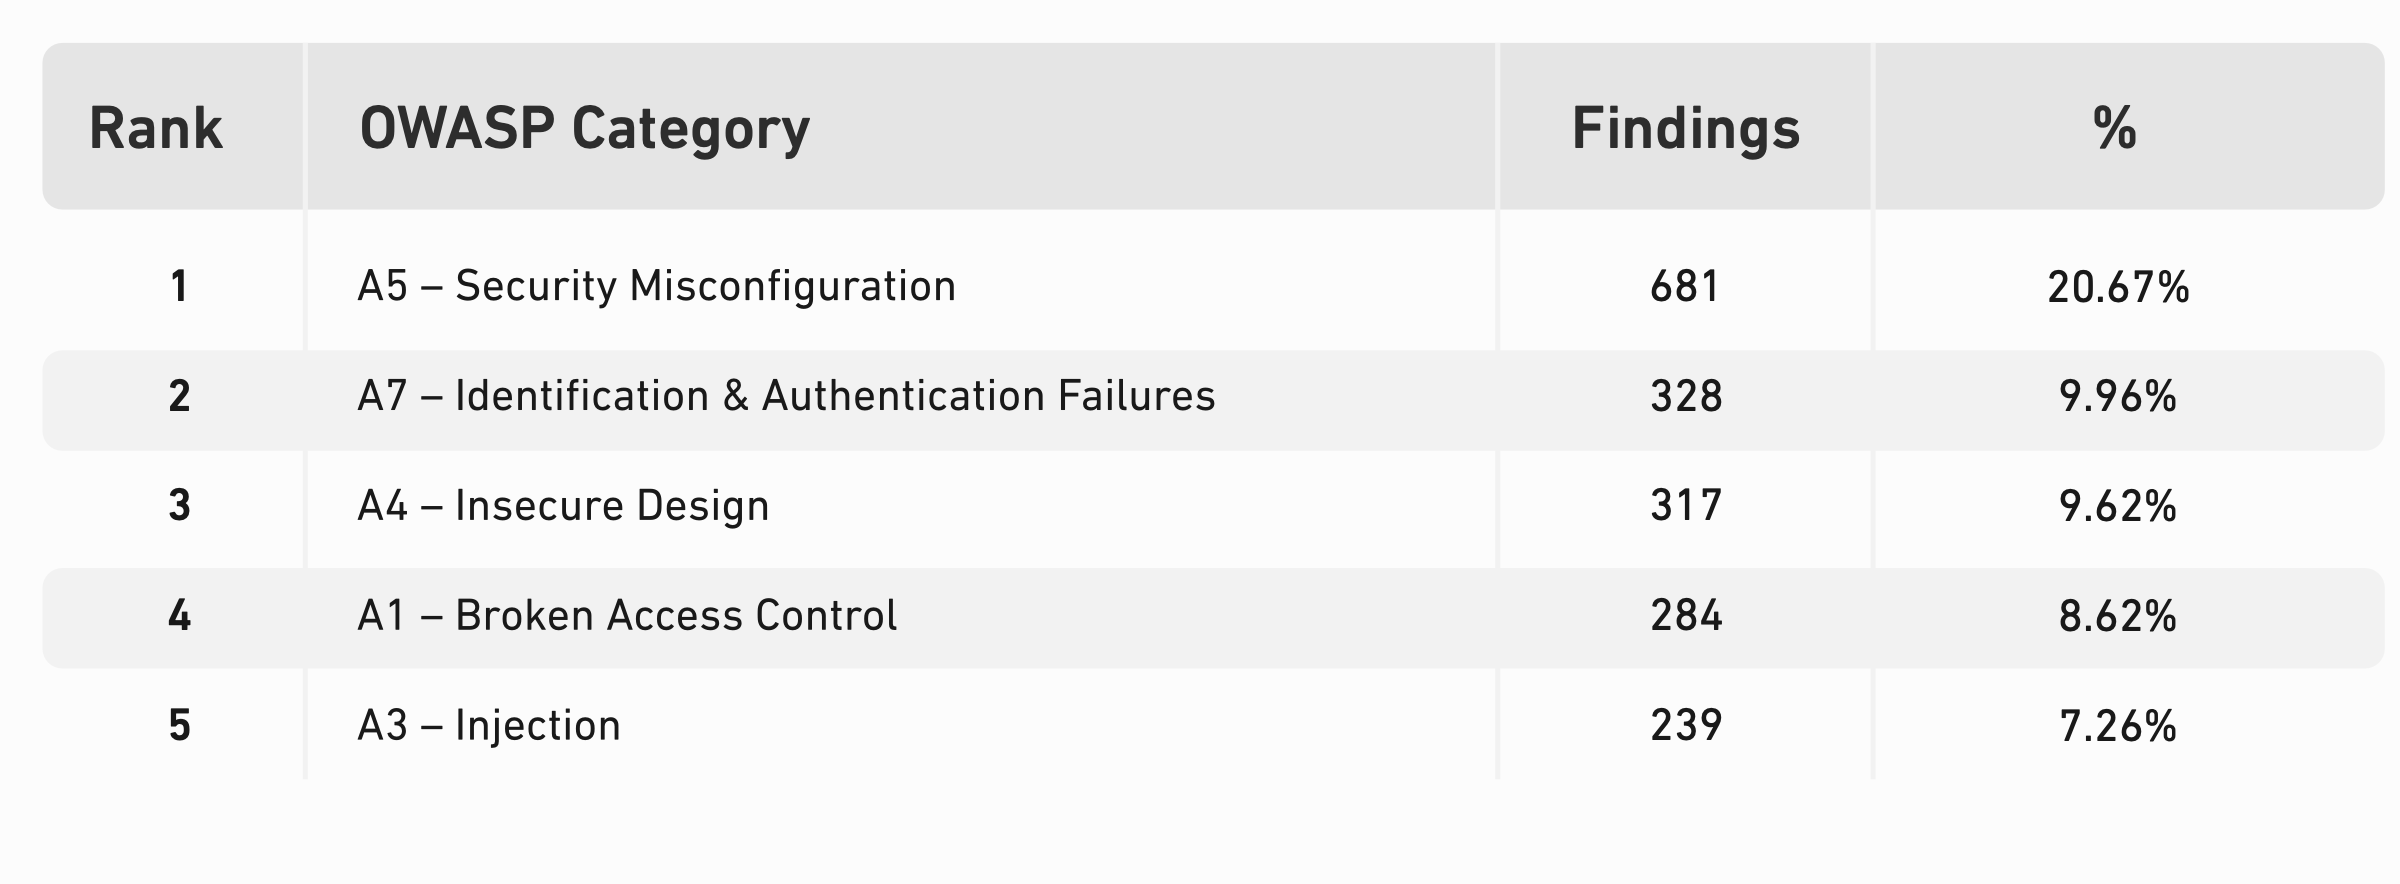
The OWASP Top 10 Reality Check
The top five OWASP categories observed across all 2025 engagements were: Security Misconfiguration (A5) at 20.67% of findings, Identification and Authentication Failures (A7) at 9.96%, Insecure Design (A4) at 9.62%, Broken Access Control (A1) at 8.62%, and Injection (A3) at 7.26%.
The prominence of Security Misconfiguration at the top is worth examining. It represents defaults left unchanged, unnecessary features left enabled, overly verbose error messages, and missing security headers — configurations that require active choices to get right, and that frequently fall through the cracks of both development and operations workflows.
Insecure Design, appearing at number three, is arguably the most important finding. The category covers architectural and logic-level decisions that cannot be remediated by patching after the fact. Design-level weaknesses are expensive to fix and tend to persist across releases. Their prominence in the dataset suggests that security is still being bolted on after the fact rather than built into software development and system design from the start.
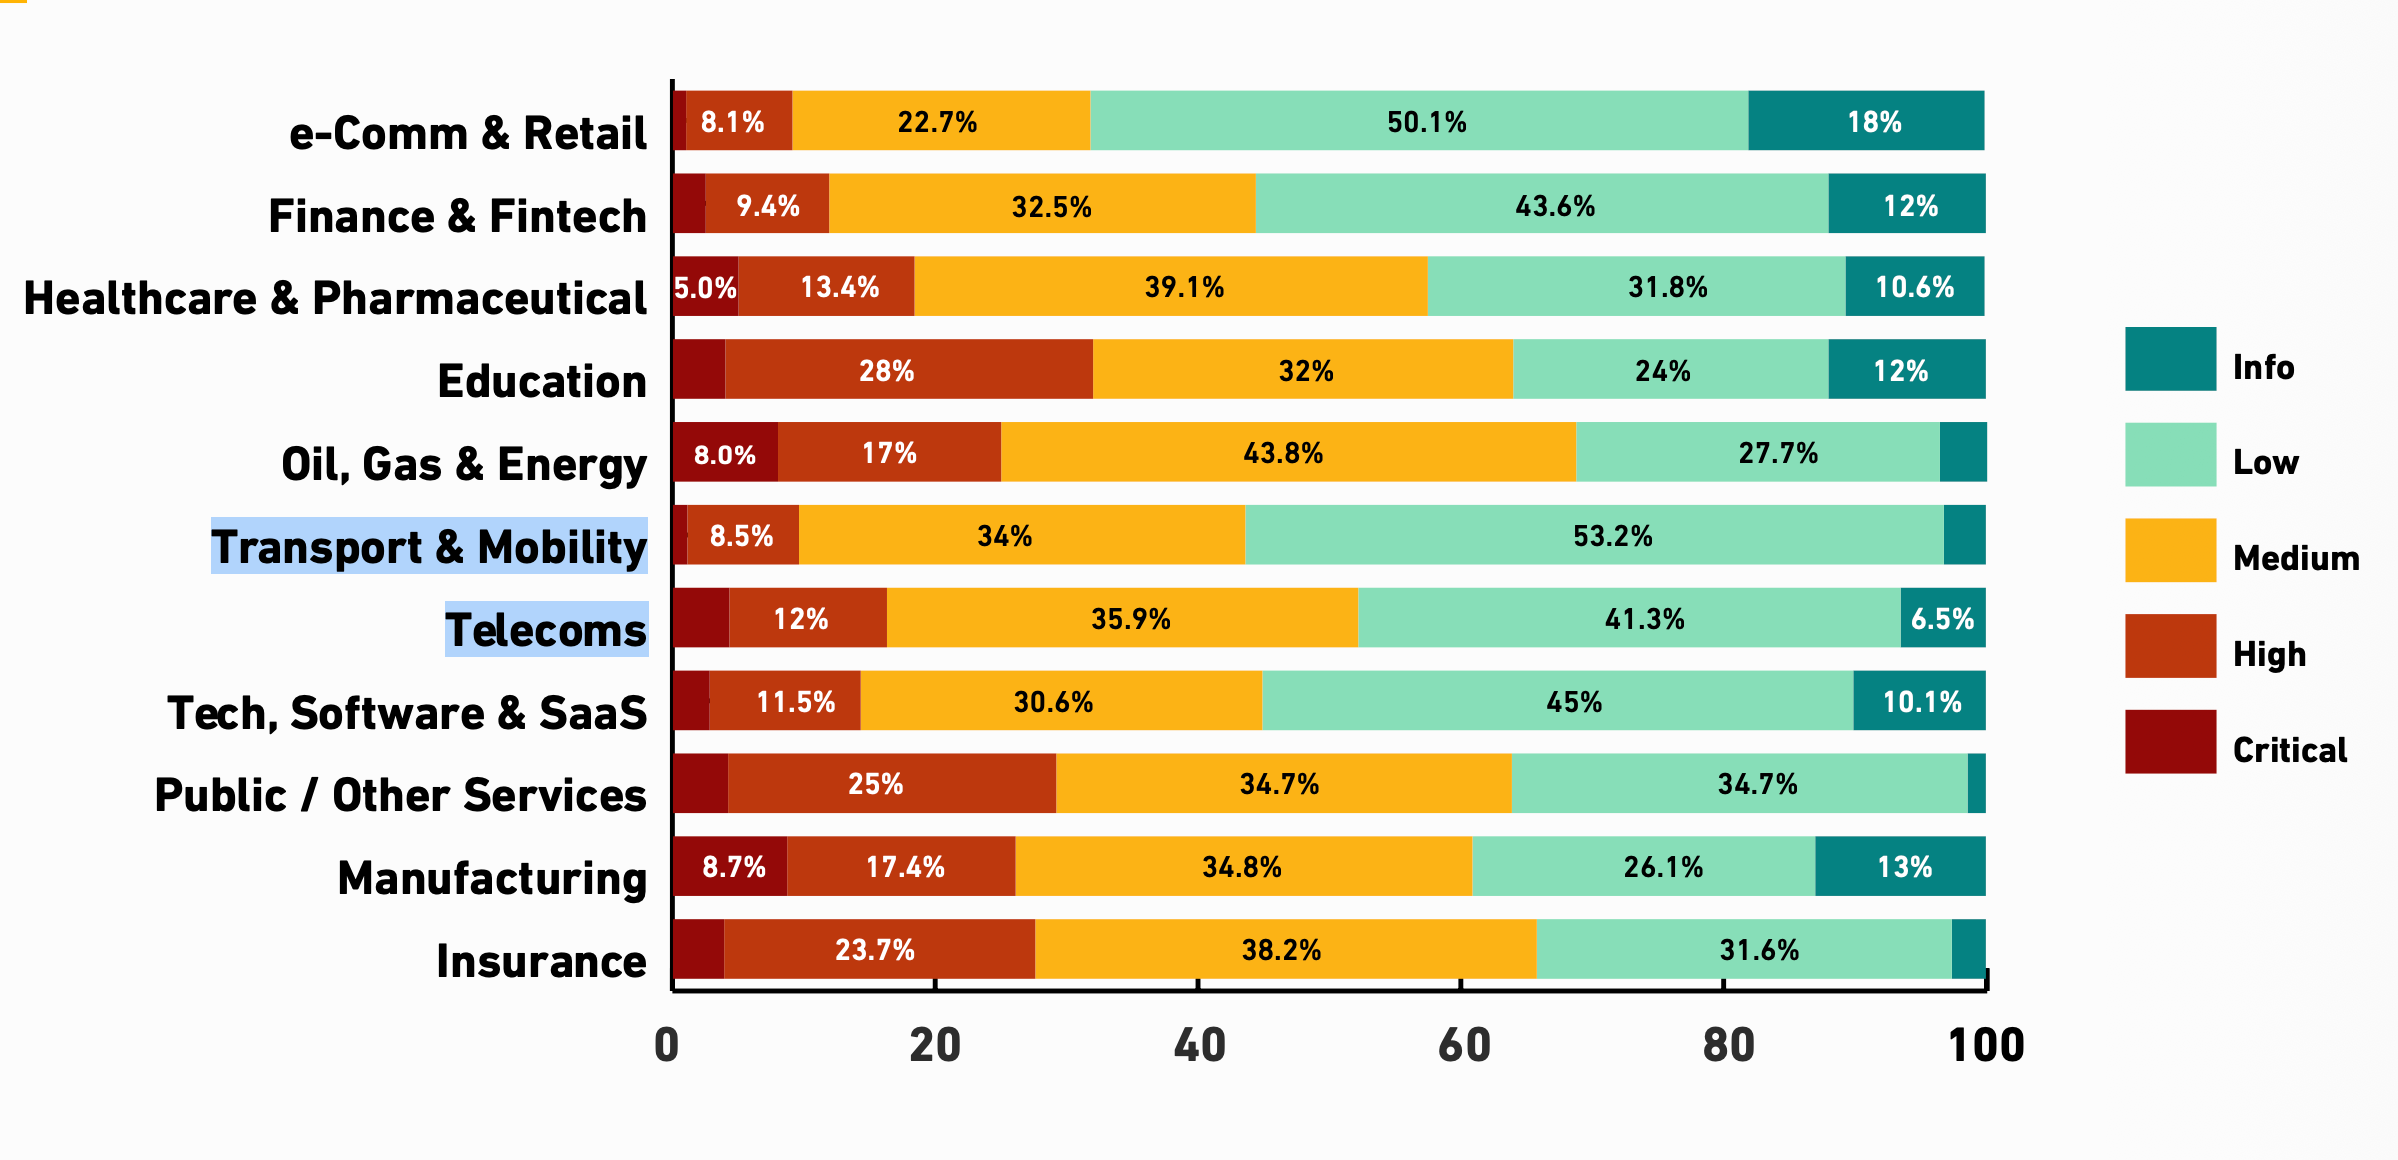
Industry Benchmarks: Where Cyber Threat Exposure Is Highest
The data surfaces a counterintuitive pattern: industries that test less frequently do not have fewer vulnerabilities — they often have more severe ones. Education, Public Services, Insurance, Manufacturing, and Oil, Gas & Energy all show higher proportions of Critical and High severity findings relative to total engagements, despite representing smaller portions of the overall dataset.
Industries with the highest concentration of high-impact findings by percentage:
- Education: 32.0% High or Critical vulnerabilities
- Public / Other Services: 29.2%
- Insurance: 27.6%
- Manufacturing: 26.1%
- Oil, Gas & Energy: 25.0%
By contrast, the heavily tested, compliance-driven sectors — Finance & Fintech at 11.9% and e-Commerce & Retail at 9.1% — show lower proportions of severe findings. More testing cadence correlates with more mature security hygiene, at least at the severity distribution level.
The Insurance sector stands out in a different dimension: at 9.50 average vulnerabilities per project, it has the highest vulnerability density of any industry in the dataset. Oil, Gas & Energy and Tech, Software & SaaS follow with 6.59 and 6.34 respectively.
Across nearly every industry, CWE-200 (Exposure of Sensitive Information to an Unauthorized Actor) is the single most common vulnerability — a weakness category frequently associated with data breaches in real-world incidents.The only exception is Manufacturing, where it does not appear in the top three at all.
Severity Distribution by Industry
Key Insights on Compliance Testing
The compliance-specific data is perhaps the most practically useful section of the report for CISOs and compliance officers focused on regulatory compliance: regulatory frameworks improve baseline hygiene but do not prevent design-level and logic-level security failures.
SOC 2-driven assessments averaged 7.0 vulnerabilities per project. Nearly two-thirds of findings required authentication — meaning the dominant cyber risk is not external compromise, but authenticated users performing actions beyond their authorization. The top findings were CWE-284 (Improper Access Control) at 12.9%, CWE-200 (Exposure of Sensitive Information) at 8.6%, and CWE-209 (Error Message Information Leakage) at 7.1%.
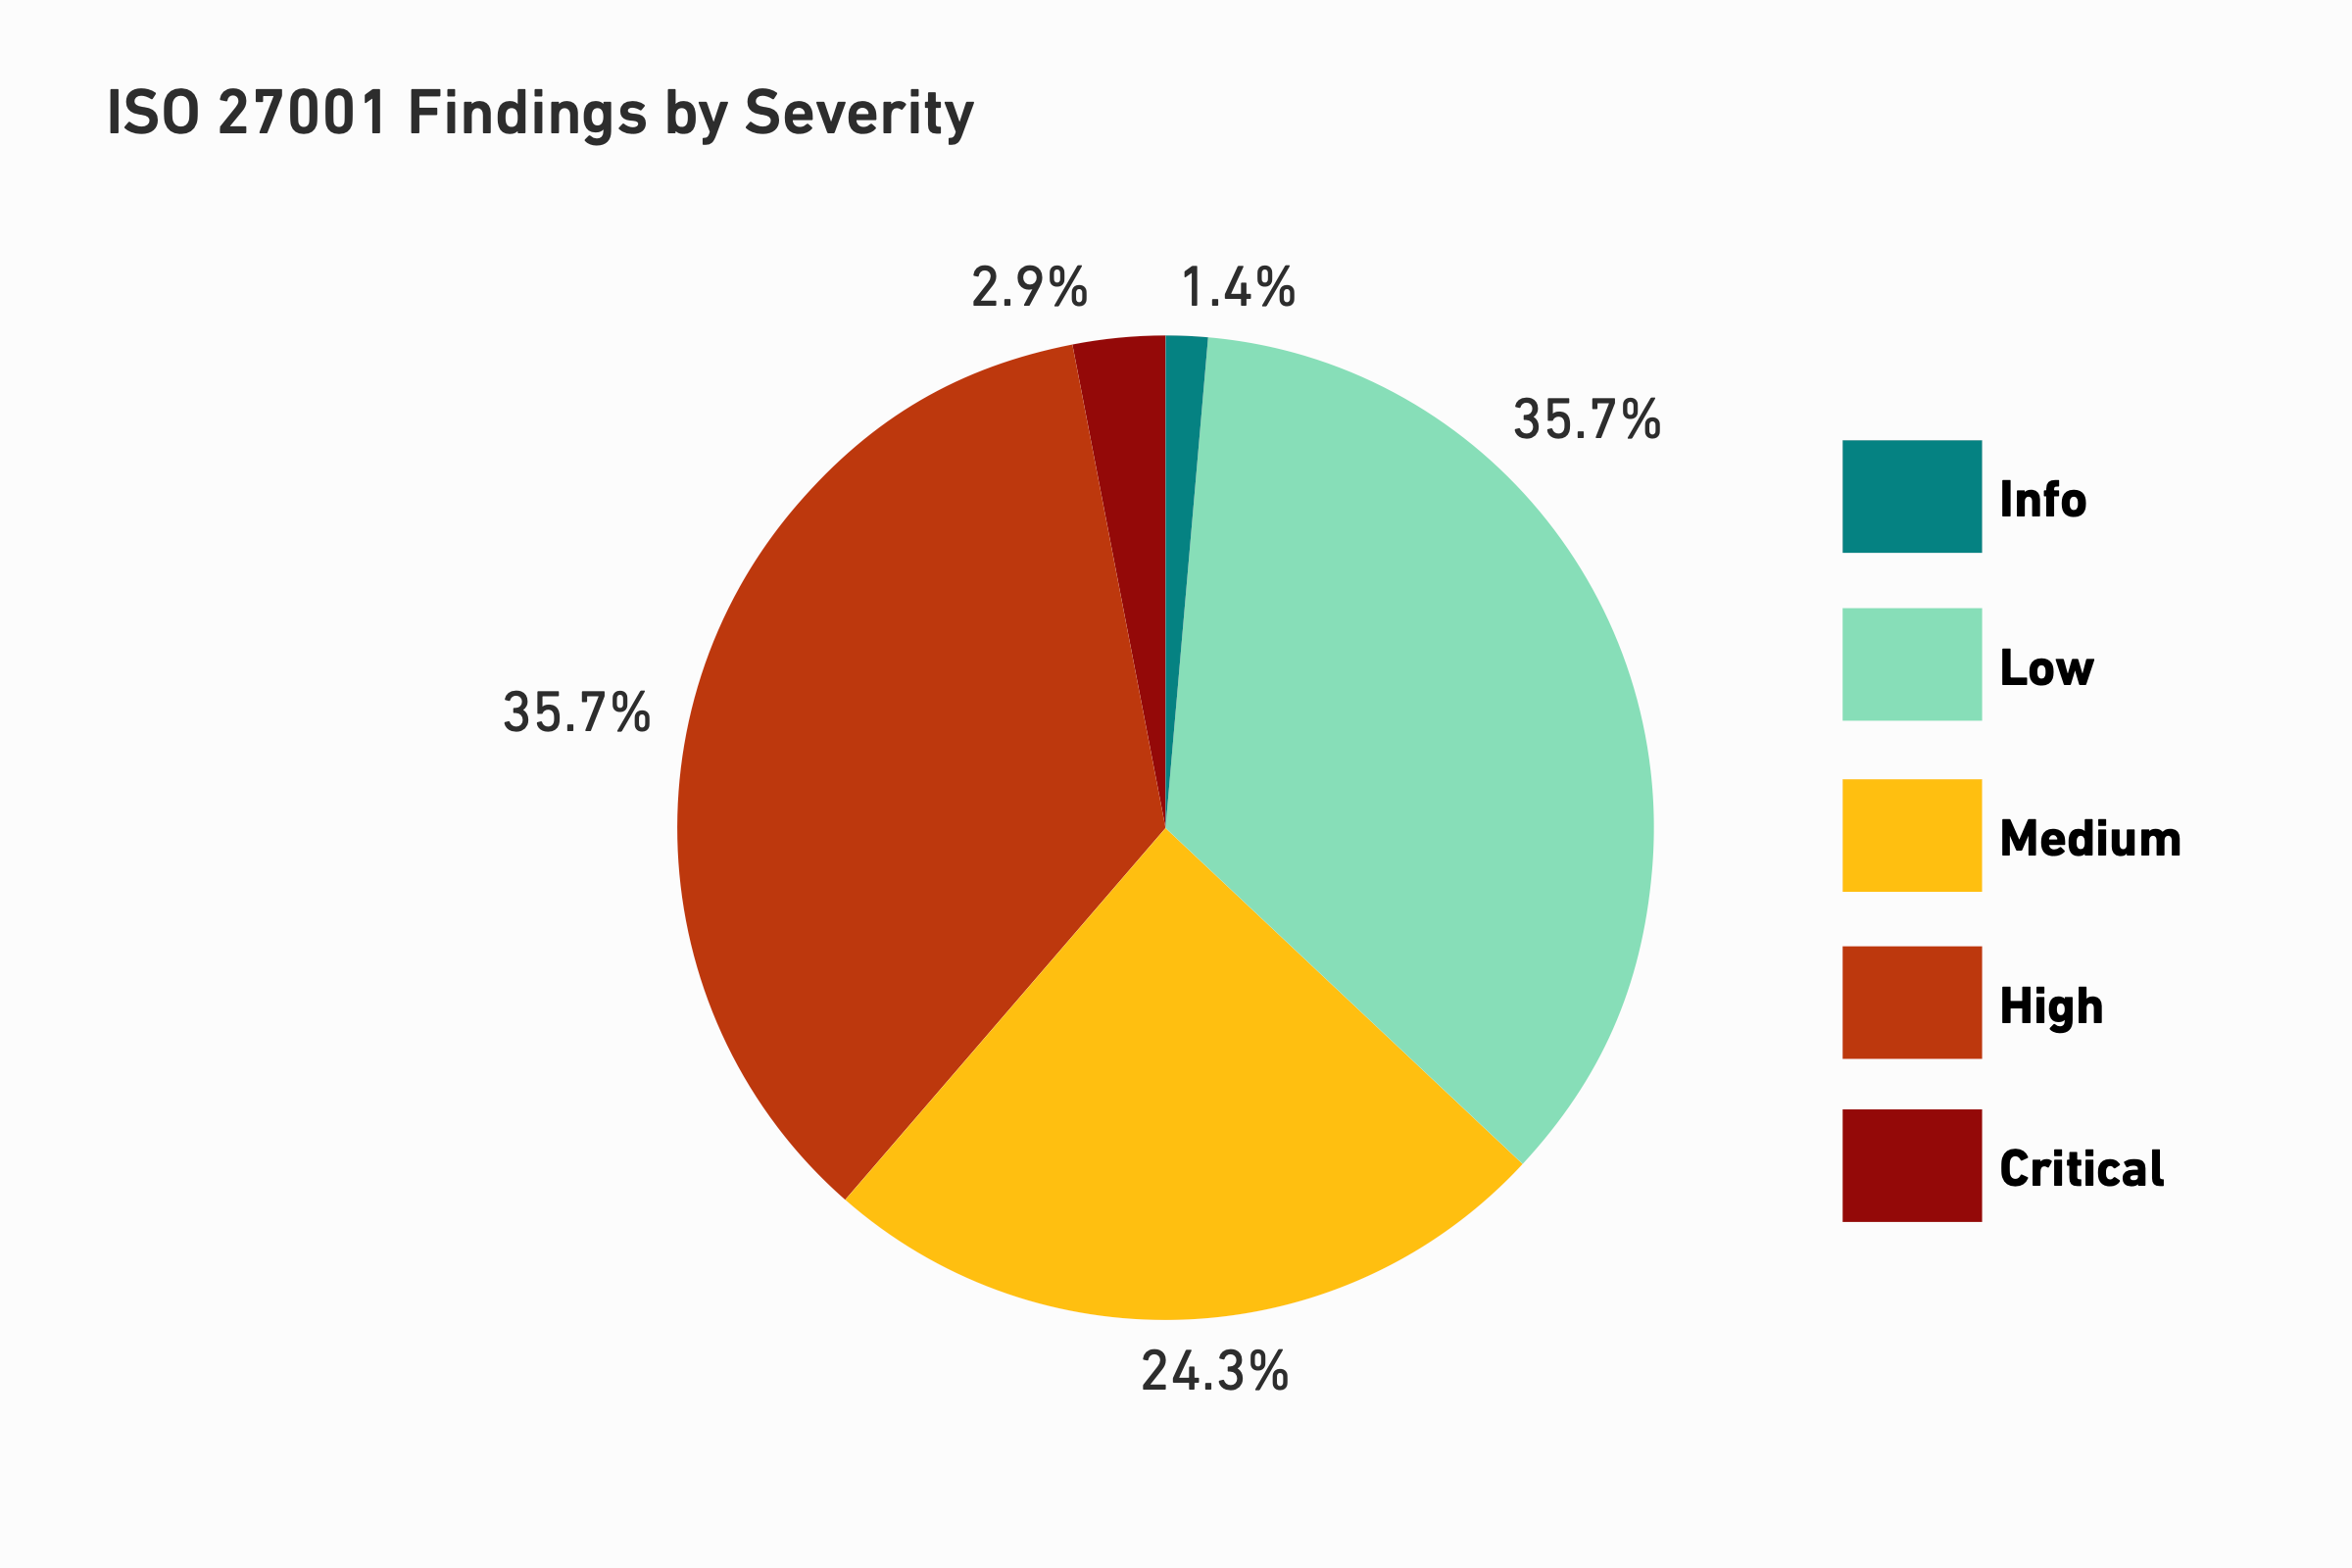
ISO 27001-driven assessments averaged 11.67 vulnerabilities per project — the highest average of any compliance context in the dataset. The attack-vector distribution showed that approximately 42% of findings could be exploited by an authenticated user abusing permissions or roles. Controls exist, but they fail in application behavior.
PCI DSS-driven assessments showed a lower overall finding count (3.1 vulnerabilities per project on average) but over one-third of those findings were classified as High or Critical. The leading weakness category was CWE-327 (Use of a Broken or Risky Cryptographic Algorithm) at 14.3%, followed by CWE-284 (Improper Access Control). Cryptographic weaknesses in PCI environments suggest that encryption is implemented but not consistently applied correctly — particularly in key management, protocol selection, and certificate handling.
The consistent message across all three frameworks: compliance improves baseline posture, but the failure mode that persists is incorrect enforcement of controls that nominally exist.
The Key Takeaway from the State of Penetration Testing Report 2025 for Security Teams
The 2025 penetration testing statistics point to a clear strategic conclusion that should inform how security leaders prioritize effort: the primary challenge is no longer building controls. A strong security strategy should ensure the controls are correct, consistent, and resilient under real application workflows and real attacker pressure.
The most effective risk reduction comes from strengthening authorization models, minimizing implicit trust, and enforcing defense-in-depth where it actually matters. For developers, that means authorization logic as a first-class design concern — not an afterthought added during code review. For cybersecurity teams, it means testing the correctness of controls, not just their presence. For compliance and risk professionals, it means understanding that a passing audit does not mean an authorization bypass cannot be reached from inside your environment.
The attack surface and security measures have matured. The gap that remains is in the space between identity and authorization – in business logic, the configurations, and the design decisions that determine what a legitimate user can actually do once they are inside.
Conclusion
The threat landscape documented here is not abstract. These are real weaknesses found in real systems, by certified cybersecurity professionals using manual and automated security tools. What the data consistently shows is that organizations with limited resources and those with mature security programs alike share the same fundamental gap: controls that exist but are not correctly or consistently enforced. For decision makers weighing cybersecurity budgets, that is a useful place to focus. The full 2025 Annual Penetration Testing Review is available here.